

Article by

Topics

One platform to manage the entire IT device lifecycle
GET STARTEDKnowing what assets you have in your IT inventory is important. But truly effective IT asset management goes much deeper than that.
In this article, we’ll look at critical IT asset management KPIs that show how well your assets are being utilized, deployed, and replaced to help optimize your entire ITAM process.
allwhere’s Recommended IT Asset Management Metrics
1. Asset Utilization Rate
2. Underutilized Asset Rate
3. Mean Time to Deploy
4. Mean Time to Retrieve
5. Asset Recovery Rate6. Asset Downtime Rate
7. Mean Time to Repair
8. Device Failure Rate
9. Average Cost Per Asset
10. Total Cost of Ownership
What IT Asset Management Metrics Are and Why They Matter
ITAM metrics use quantifiable data to assess how effective your company’s asset management process is. Asset performance metrics allow you to objectively measure things like asset utilization, cost, security, and the overall performance of your asset lifecycle.
As assets move from stage to stage from procurement, deployment, management, storage, and retrieval — performance metrics provide visibility throughout.
That way, you gain valuable insight into what is and isn’t working with your asset management practice, and you can identify specific areas within your asset lifecycle management to improve.
And this offers a ton of benefits, with one of the biggest being improved asset utilization. By identifying underutilized assets, for example, you can decide what could potentially be removed from your asset inventory for better utilization.
Key performance indicators also help improve resource allocation, so you can provide your team with the exact IT assets they need to reduce unnecessary spending and right-size your inventory.
And by analyzing deployment and retrieval asset management KPIs with asset management software, this often leads to quicker, more efficient deployment and retrieval with fewer hiccups, like losing assets during shipping.
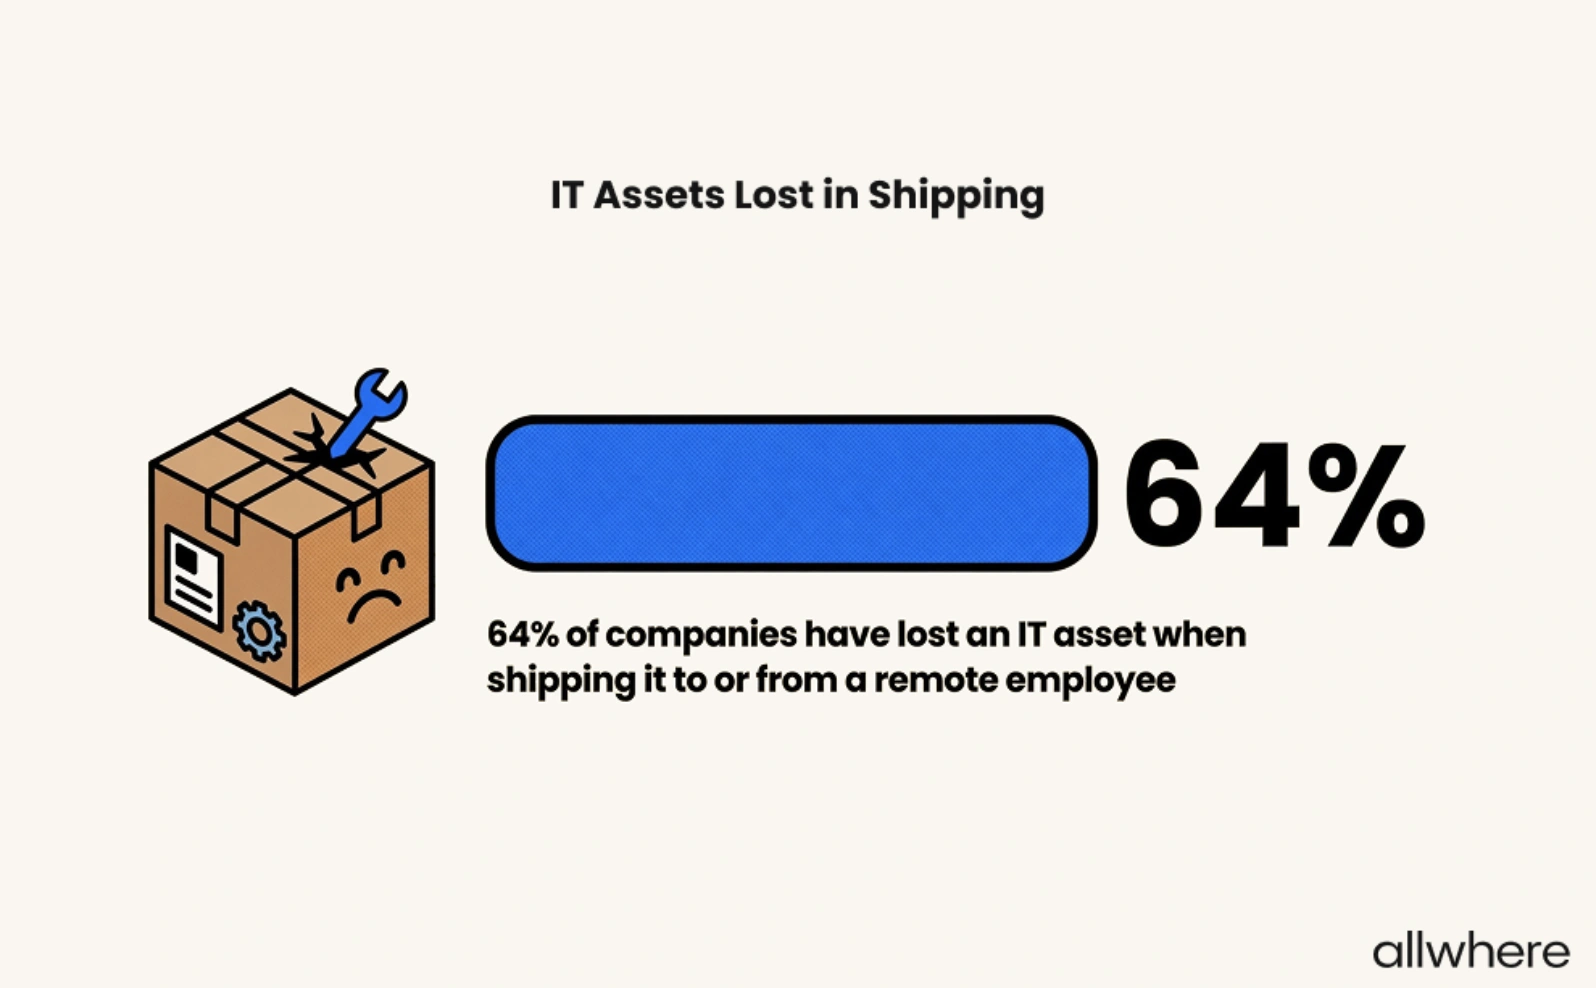
This is important given that 64% of companies have lost an IT asset at some point when shipping to or from a remote employee.
Asset Utilization Metrics
Asset Utilization Rate
The first of the utilization performance metrics analyzes the percentage of IT assets in your inventory that are actively being used. It’s a simple way to determine what percentage of your hardware assets, software assets, and cloud assets are being used efficiently.
And if your asset utilization rate is lower than what it should be, this often indicates a high number of underutilized assets and overspending.
When this is the case, you’ll likely want to trim back on your number of assets to increase operational efficiency.
Here’s the formula for calculating your asset utilization rate.
(The number of assets you’re currently using / your total number of assets) x 100
If, for example, you have 100 total laptops in your IT inventory and 90 are currently in use, you would have an asset utilization rate of 90%.
With the target range falling between 85 - 90% for most companies, that would be an acceptable utilization rate for your asset management team.
Underutilized Asset Rate
This term is defined as the number of assets that are assigned or available to employees that aren’t being used to their intended capacity.
Say, for example, that you’ve deployed 100 laptops to your workforce, but a percentage of them are only rarely used. The laptops that are rarely used would be considered underutilized.
Note that what constitutes as underutilized can vary from organization to organization, but for most IT equipment, anything that falls below 30% would qualify.
Here’s the formula for calculating this asset management performance metric.
(The number of underutilized assets / your total number of assets) x 100
If you have a higher-than-ideal underutilized asset rate, it usually means you’re not getting your money’s worth from your IT investment.
In this case, it’s smart to consider reselling or decommissioning certain assets to lower your spending and get more value from your investment.
Asset Lifecycle Metrics
Mean Time to Deploy
This critical asset metric measures the average time it takes your organization to configure and deliver an IT asset to an employee during lifecycle management.
In the case of a laptop, for instance, this could include installing software and apps, configuring access controls, setting up security features, and handling shipping and delivery.
Having an excessive mean time to deploy can be problematic because it indicates inefficiencies, can slow down employee onboarding, and can sour the employee experience.
Given that our survey found that nearly a third of employees didn’t have all of the equipment and technology needed to perform their job on their first day (31.5%), and only 45% of accounts, software, and system access was fully set up and working, this is an area that many companies could improve in.
To calculate mean time to deploy, follow this formula.
Your total deployment time / your total number of deployed assets
Mean Time to Retrieve
Here, you’ll measure the average length of time it takes to retrieve an IT asset from an employee, which uses the following formula.
Your total retrieval time / your total number of assets retrieved
This is a metric that’s primarily used by companies with a heavy remote/hybrid workforce, where it’s important to efficiently retrieve equipment so that it can be promptly redistributed, resold, or decommissioned.
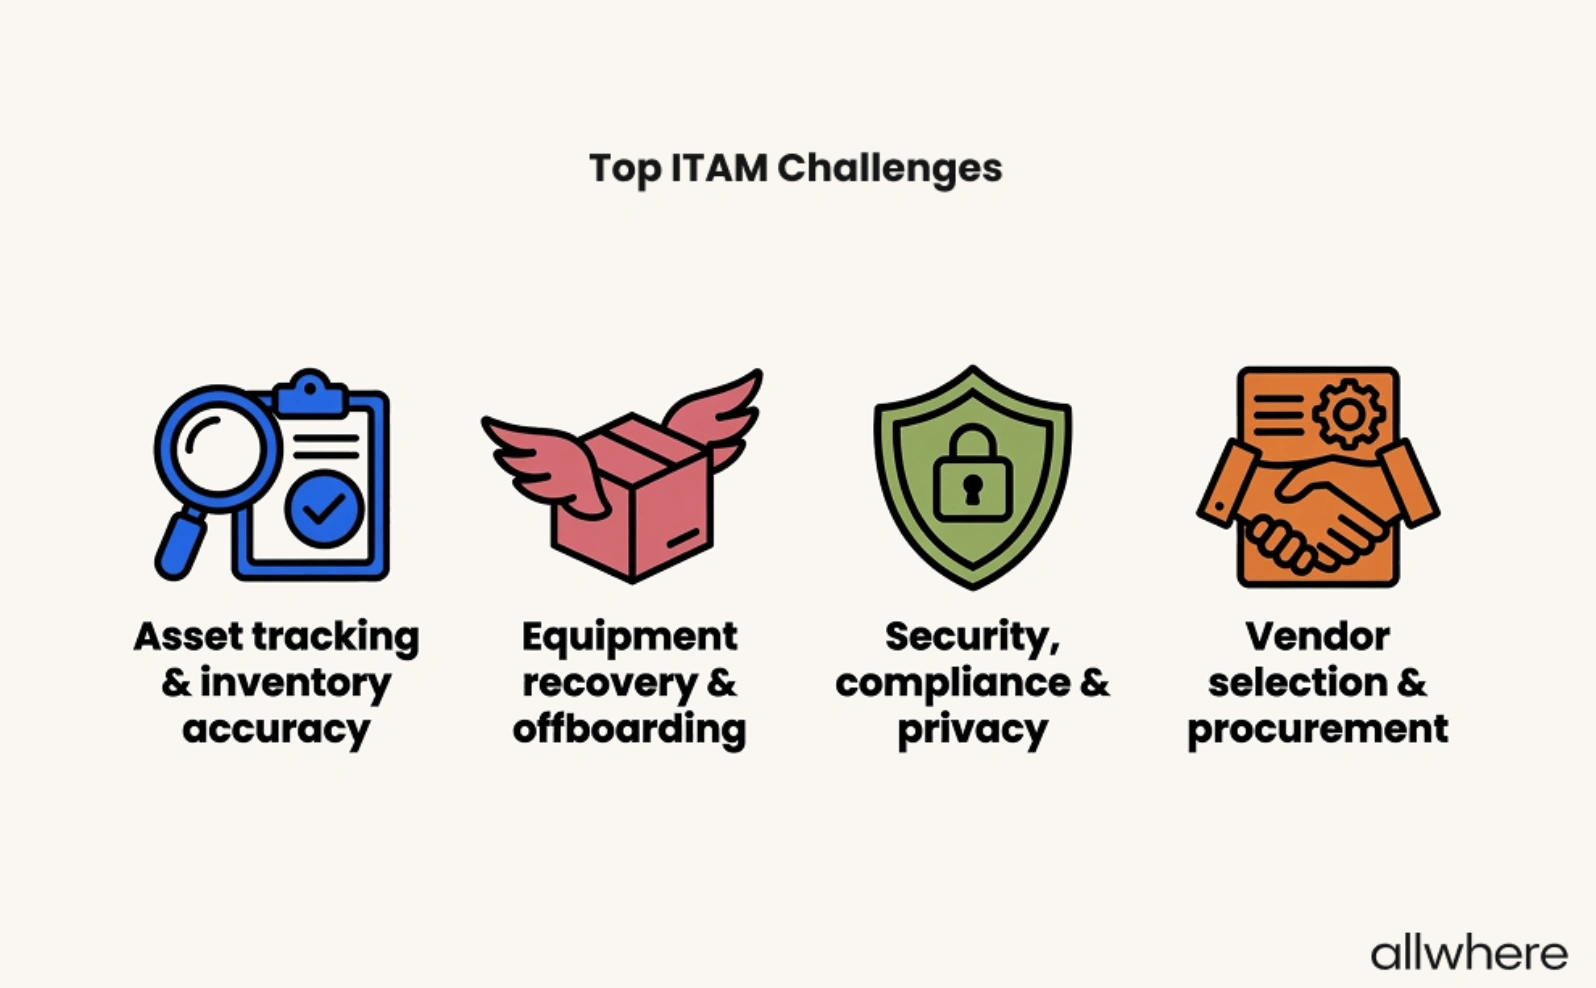
Note that our article on IT asset management best practices found this to be a common issue for many of today’s organizations. In fact, equipment recovery and offboarding was ranked as the second biggest hardware asset challenge, according to the IT manager survey we did.
That’s why your asset manager needs to establish streamlined retrieval workflows, such as sending a return kit with a box, a return shipping label, packing materials, and clear instructions, while also using asset tracking until the return reaches its destination.
And if this isn’t something your organization has time for, you can always use IT asset management services like allwhere, which handles all of the logistics and communication while offering end-to-end asset tracking.
Asset Recovery Rate
This final asset lifecycle metric measures the percentage of assets that are successfully recovered when employees are required to send them back.
The formula is as follows.
(The number of assets successfully recovered / the number of assets due) x 100
As we mentioned earlier, 64% of companies have lost an IT asset at some point during the deployment or return process. (Again, from allwhere’s unique industry research.)
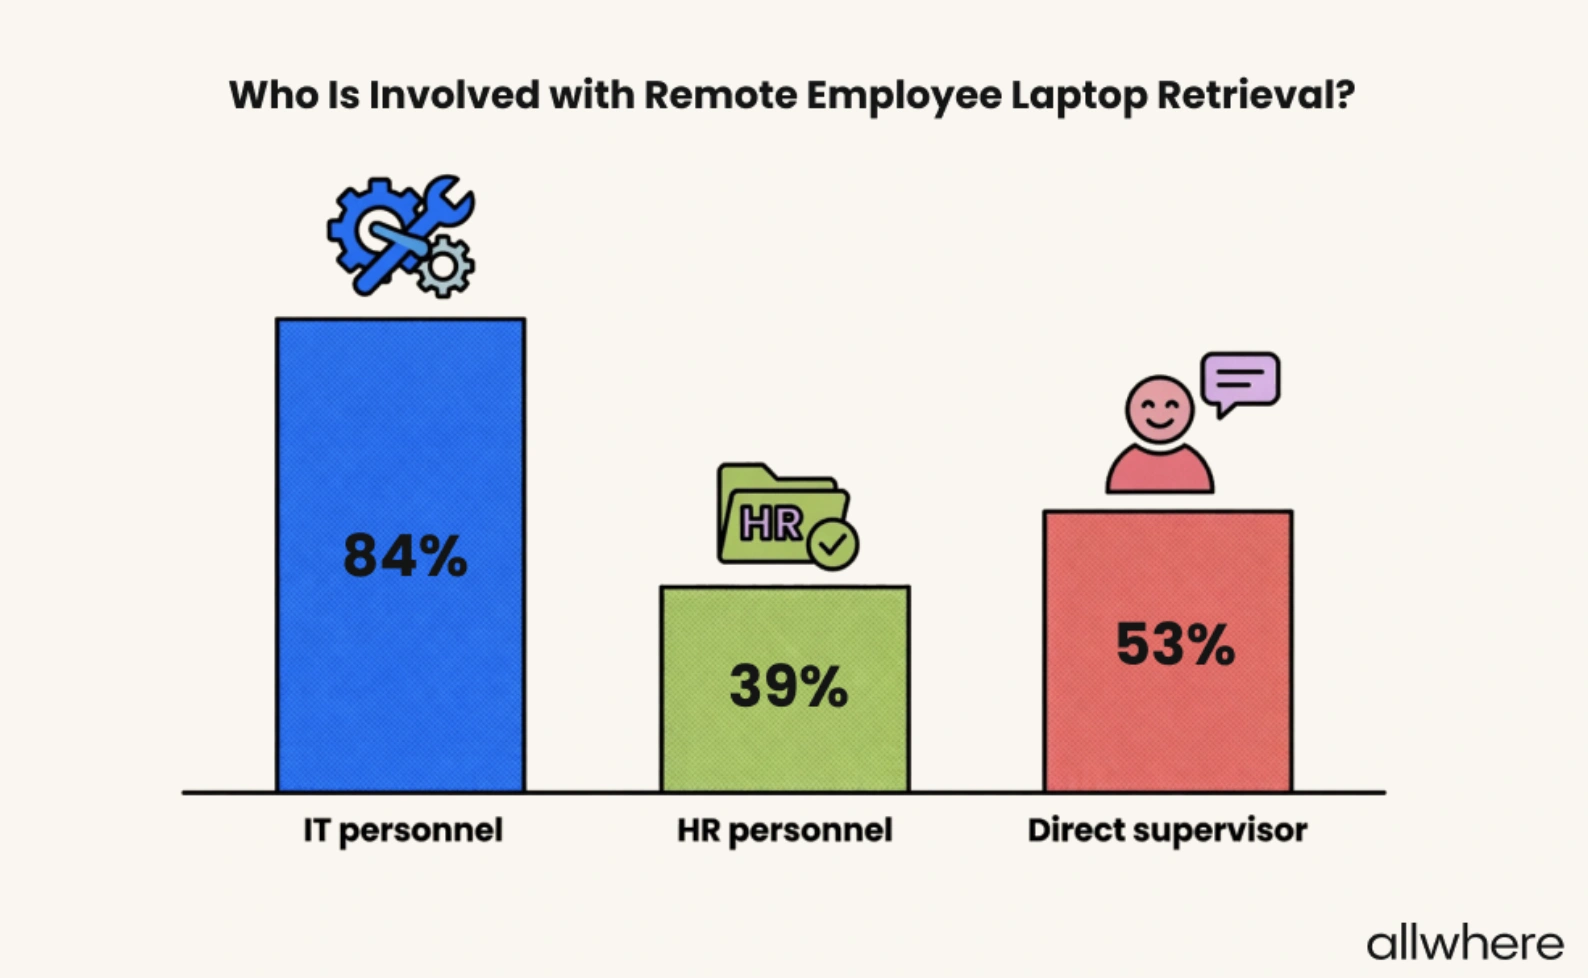
That’s why it’s vital for your organization to assign someone to oversee equipment retrieval — something that’s primarily done by IT personnel. Here are the details of how this role breaks down at the companies we surveyed.
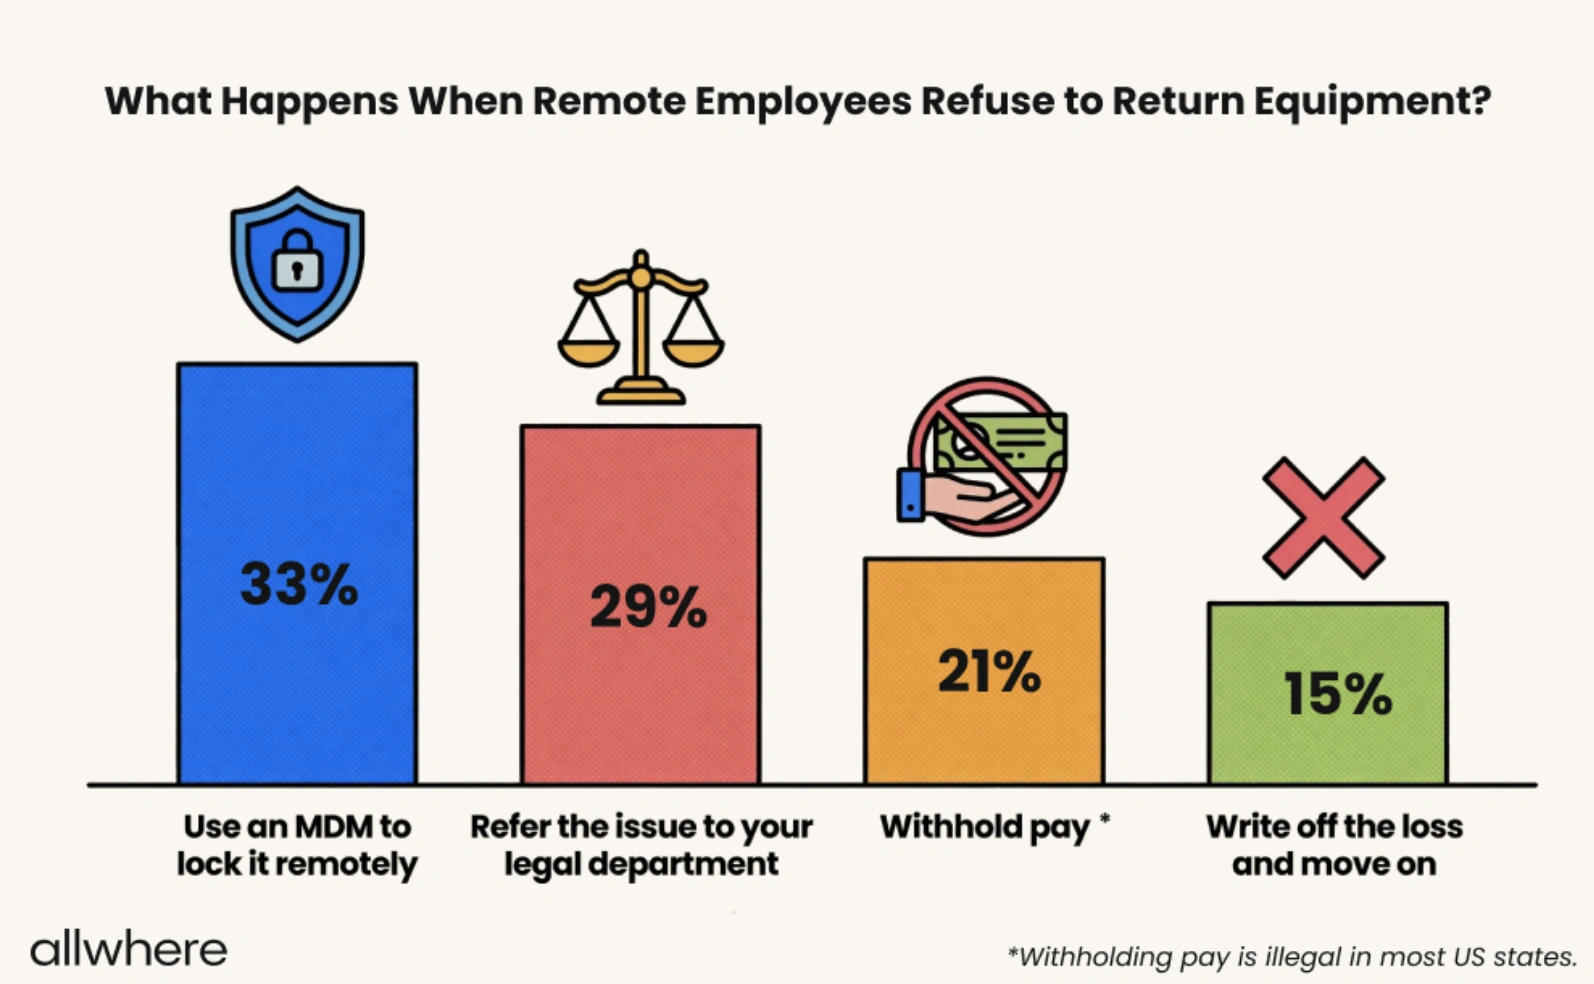
Also, you’ll need to have a plan for what you’ll do if a remote employee refuses to return equipment. Here are some common asset management solutions that companies take.
Asset Performance and Availability Metrics
Asset reliability is incredibly important for your organization. After all, it doesn’t matter if you have a huge inventory of cutting-edge devices if you’re constantly dealing with performance issues and downtime.
And that brings us to the main metric in the asset performance/asset availability category — asset downtime rate. This measures the average amount of time that devices are unavailable due to malfunctions and repairs.
Here’s how to calculate asset downtime rate for your ITAM report.
(The total number of downtime hours / the total required number of operating hours) x 100
If your organization finds this number to be high, it can limit your employees’ collective productivity and lead to above-average repair costs. And in some cases, this may indicate that devices are approaching the end of their lifecycle and need replacement.
For perspective, a typical business laptop lasts 3-5 years on average.

It’s also helpful to measure your device failure rate, which is the percentage of your total IT assets that are unavailable during a given period of time because of hardware issues.
The practical application here is to use the asset data you generate to determine whether certain manufacturers and models have a higher device failure rate than others.
Besides that, you may want to measure your mean time to repair, which is the average amount of time it takes your organization to repair a device and get it back to working condition.
Cost and ROI Metrics
There are two last key performance indicators to cover — both of which relate to helping you get the most from your IT investment.
First, there’s the average cost per asset, which is simple to calculate.
Your total IT asset costs / your total number of IT assets
This should provide you with a basic overview of how much you’re spending across the board, so you’ll know if it aligns with your budgetary goals.
The second of these asset management KPIs is your total cost of ownership, which can include how much you pay for:
- Deployment
- Planned maintenance
- Unplanned maintenance
- Service management
- Inventory management (asset discovery and asset management tool)
- Storage
- Repairs
- Retrieval
Also, take into account how much you spend on things like software and cloud-based subscriptions, as these will also impact the total cost of ownership.
Turning Asset Management Data into Action
Whether you’re a smaller organization or doing enterprise asset management, generating objective insights using key performance indicators is crucial to reaching your goals at every stage of the asset lifecycle.
The metrics listed above should check all of the boxes and offer a bird’s-eye view so you’ll know what to focus on with hardware, cloud, and software asset management.
If you’re feeling a little overwhelmed with all of the complexities of IT asset management, consider partnering with allwhere.
We’ve been ranked as one of the best IT asset management companies and offer a mix of asset management software and services to cover the full spectrum — from procurement and deployment to storage, management, and retrieval.
We also provide detailed asset tracking every step of the way and let you monitor everything from a single dashboard within our asset management software platform.
